← All Danish shipping sensitivity maps
Marine sensitivity map – Noise
The sensitivity maps describe marine sensitivity based on publicly available data. They are divided into four pressure groups: Presence, Noise, Light and Discharge. Each map is designed to support the assessment and mitigation of impacts related to a specific pressure type.
This page holds the Noise map, provided in four formats: SHP, TIFF, JPG and KMZ.
If you have any questions, please send an email to emfn@dhigroup.com
SHP Shapefile
SHP files are vector-based GIS files containing sensitivity classifications:
These files can be imported into a variety of software applications for further analysis and visualization. Download all five files below and keep them in the same folder.
Coordinate system: WGS 84 / UTM zone 32N
TIFF Raster
TIFF files are raster-based files that can be imported into GIS software. A corresponding symbology file is included for visualization. The colour scale ranges from light to dark, representing low, medium and high sensitivity, respectively.
- noise.tif
- noise_symbology.lyrx (ArcGIS Pro symbology)
JPG Image
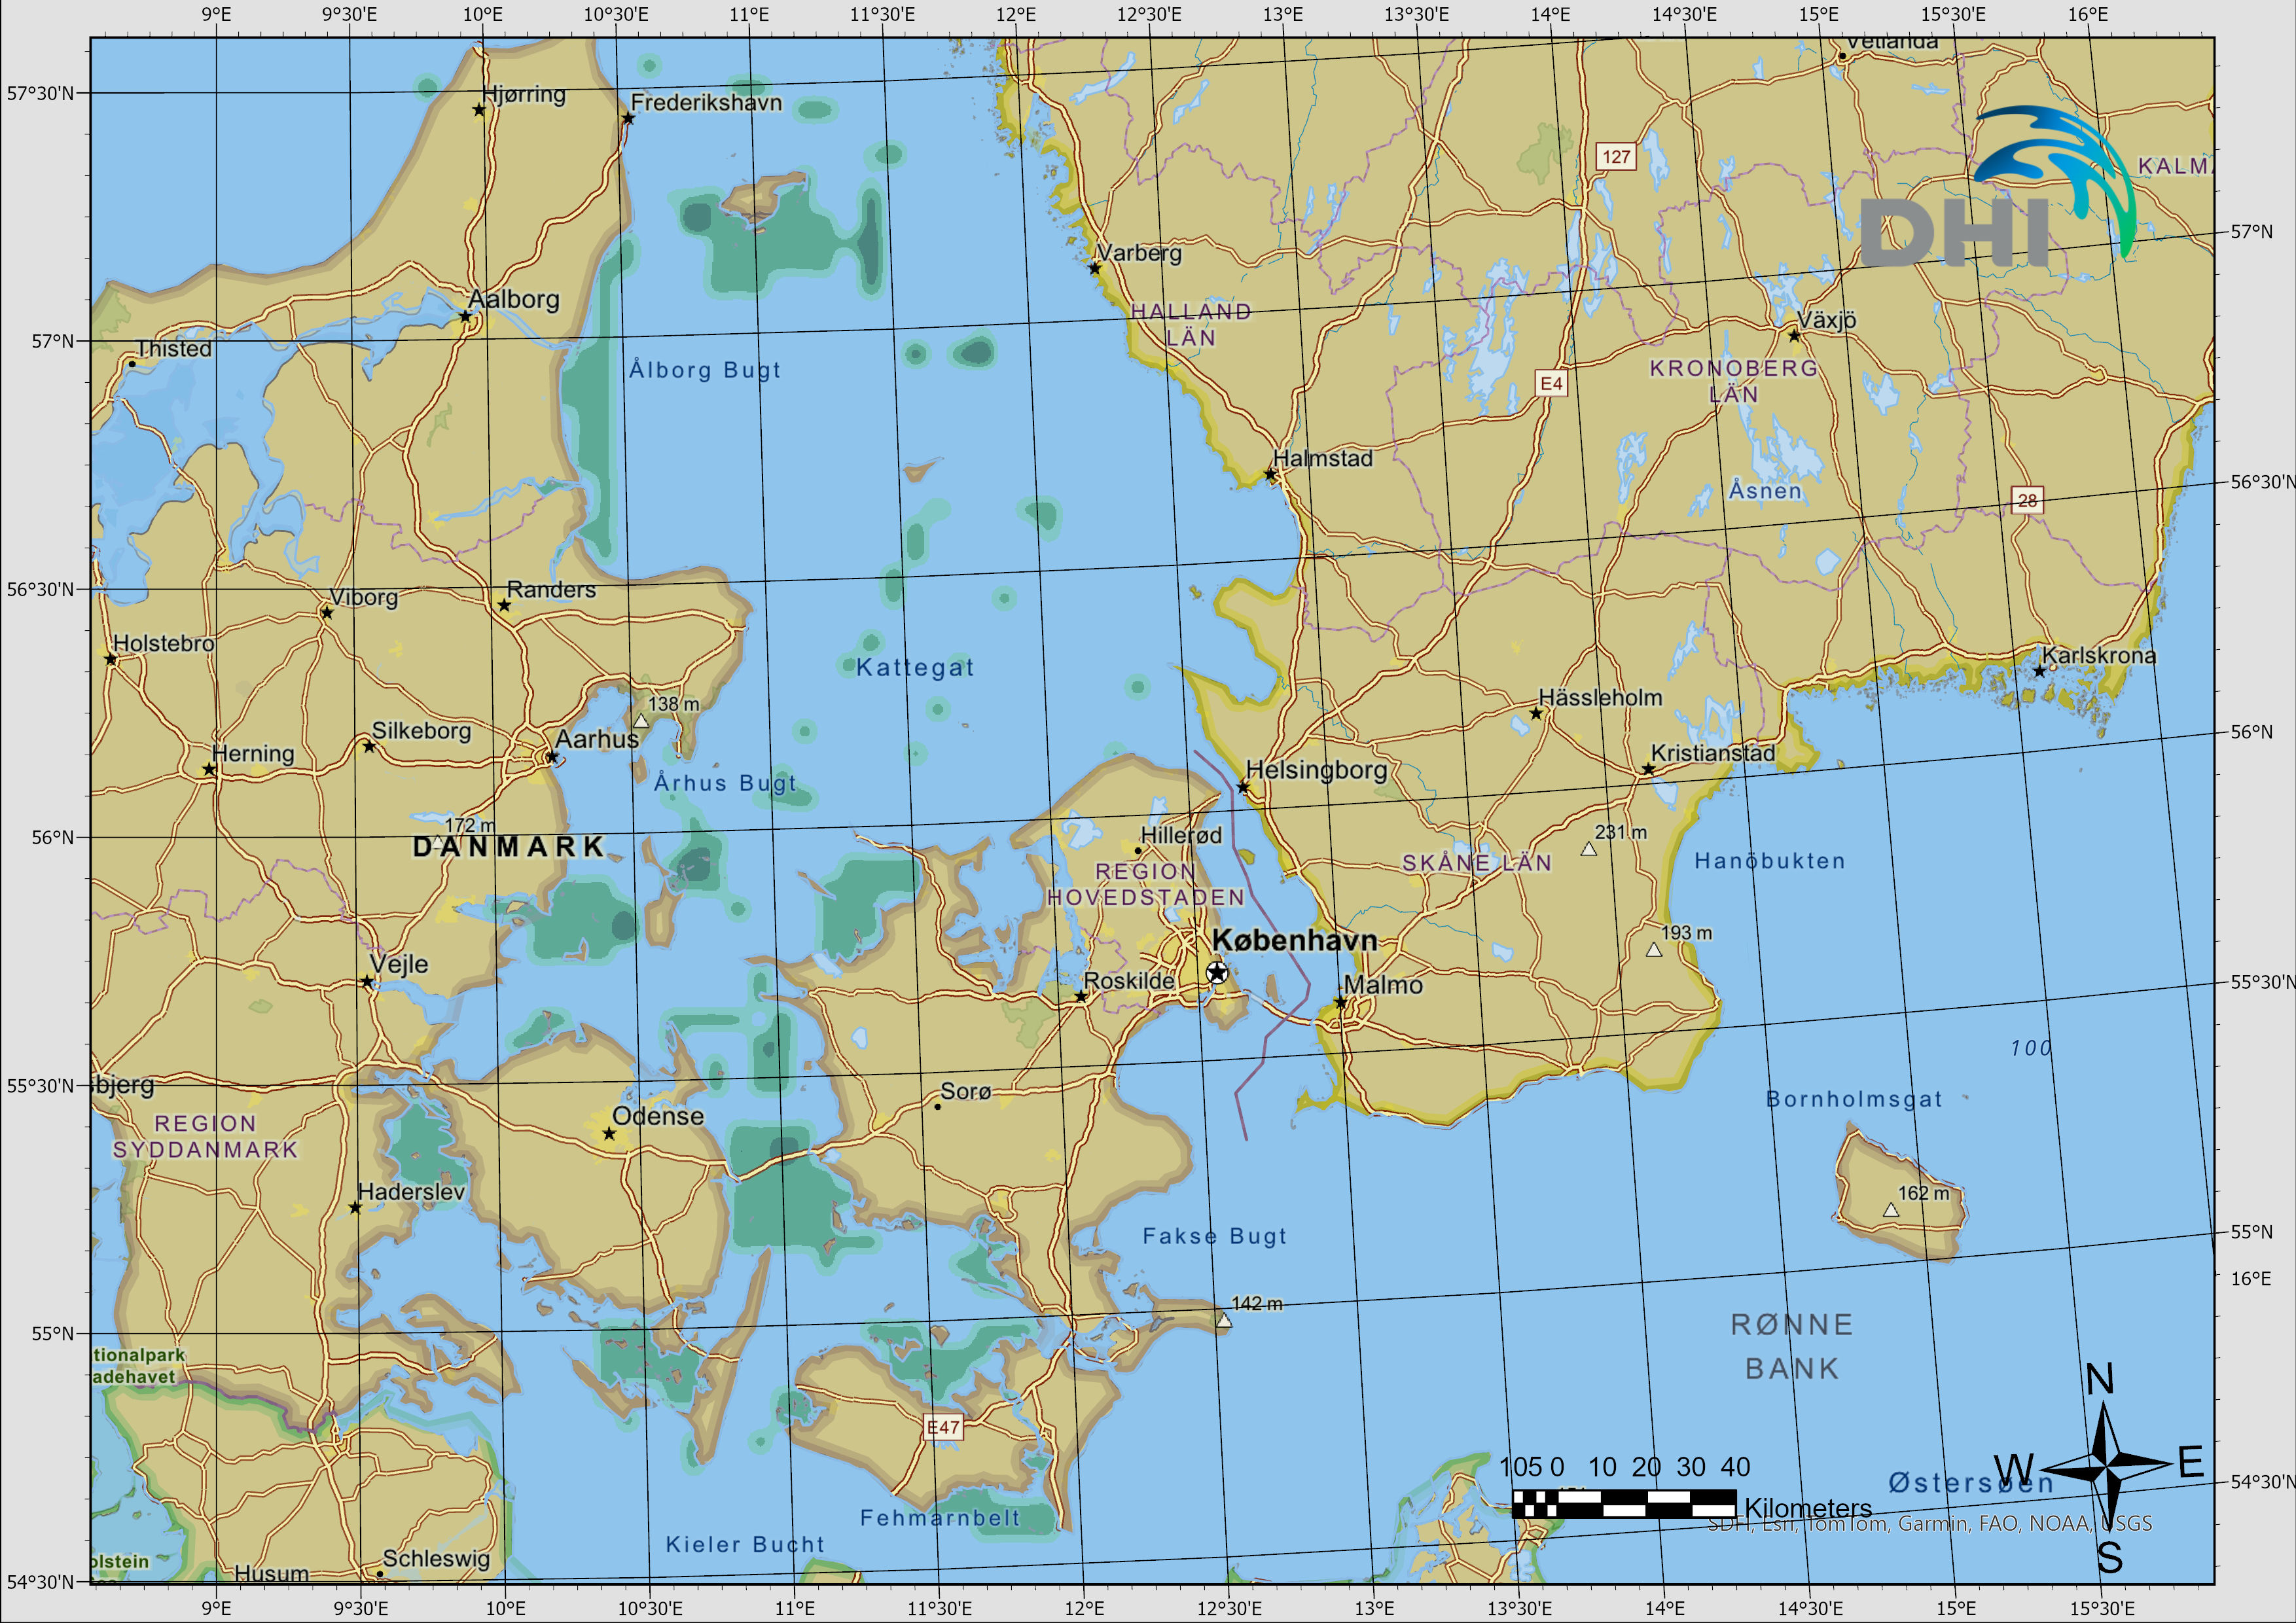
JPG files provide a static image of the sensitivity map for quick viewing and use in reports, presentations or other documents. No GIS software is required.
KMZ Google Earth
KMZ files can be imported directly into Google Earth, allowing users to view and explore the sensitivity maps in an interactive environment.